2.2.1. Monitor Group(s)
This section gives an overview of the overall status of the device types. Additionally you can click on the group name to see all the devices (and their details) in that group.
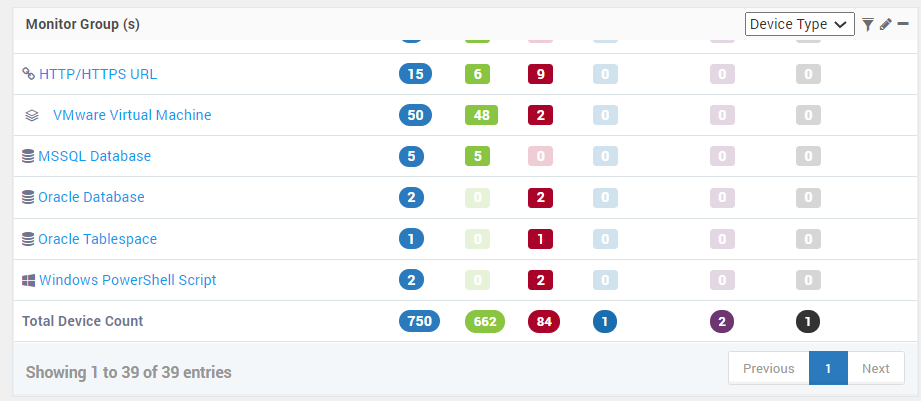
Monitor Groups
Use the ‘View Type’ to see the groups either based on Device Types or Tags. The following health statistics show up in this section:
Tag: (Available when view type is ‘tag’) Shows the name of the tags.
Name: (Available when view type is ‘Device Type’) Shows the name of the source device types.
Total: Total number of monitor in the respective group.
Up: (Default Severity Color: Green) Number of monitors in Up state in the respective group. Motadata either pinged the monitors or monitors are in reachable state.
Down: (Default Severity Color: Red) Number of monitors in Down state in the respective group. The number of monitors which could not be pinged or have invalid credentials or the device is down.
Maintenance: (Default Severity Color: Blue) Number of monitors in Maintenance state in the respective group. You may turn ON or OFF the maintenance for any particular device by navigating to Monitors > Actions. If you turn on the maintenance for any device Motadata will not even ping the device and hence will not poll the details of that particular device
Disabled: (Default Severity Color: Purple) Number of disabled monitors in Disabled state in the respective group. To Enable/ Disable a monitor you need to navigate to Monitors > Actions and choose the required device. If you disable any particular device then you will not receive any alerts related to that particular device. Even if the device is disabled Motadata will still ping the device.
Unknown: (Default Severity Color: Black) Number of monitors in Unknown state in the respective monitors group.
Total Device Count: Shows the total devices in the monitor groups display.
Additional Read: Widget Options